
Data Analytics Competitions
Data Analytics competitions are a particular type of Data Science competition whose goal is to answer substantive research questions provided by the organising company. Unlike Machine Learning competitions, typical Data Analytics competition usually revolves around the usage of interpretable models while submissions are evaluated based on the expert opinion of the jury.
Together with Kate Melianova, we participated in a few such competitions over the last years. Here you can find a short description of all our winning submissions.
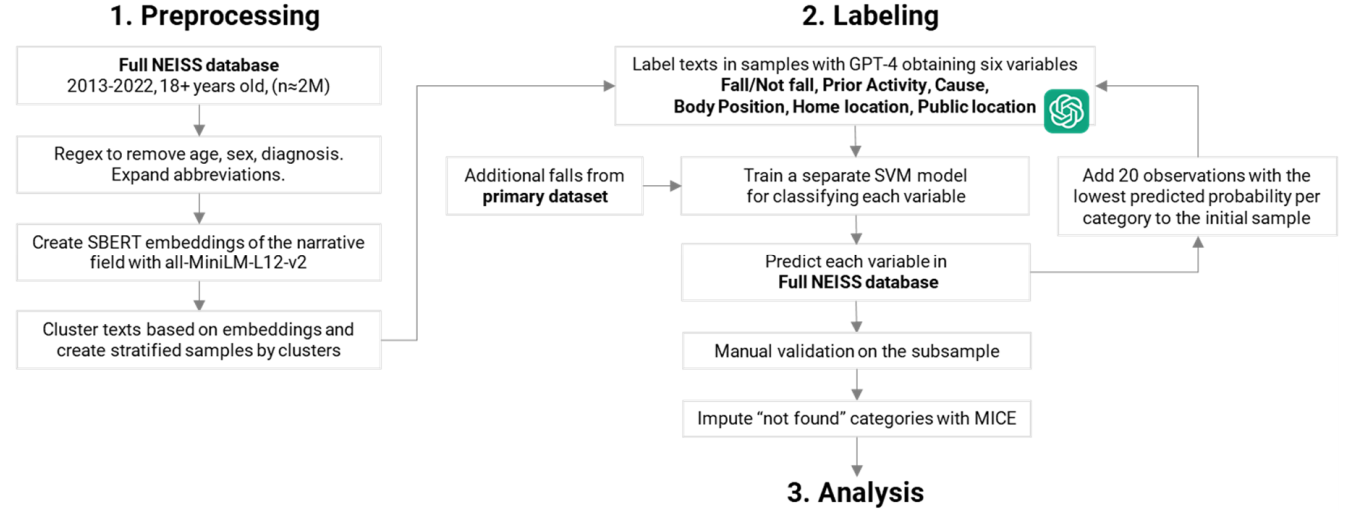
7. Unsupervised Wisdom: Explore Medical Narratives on Older Adult Falls
- Organizers: CDC
- Dates: August 6, 2023 – October 6, 2023
- Task: To explore the application of unsupervised machine learning methods on emergency department visit narratives about older adult falls.
- Data: Large public dataset of narratives from the sample of emergency departments in the US.
- Submission: Applied LLMs in combination with an SVM classifier to label a large dataset of medical texts.
- Result: 1th place – $25,000
- Links: DrivenData, GitHub
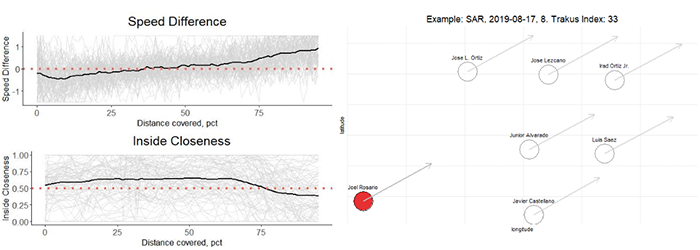
6. Big Data Derby 2022
- Organizers: NYRA, NYTHA
- Dates: August 11, 2022 – November 10, 2022
- Task: Analyze horse racing tactics, drafting strategies, and path efficiency.
- Data: Detailed GPS tracking data.
- Submission: Extraction of different racing strategies using clustering methods. Assessing the effectiveness of these strategies using interactions and random effects in multilevel models.
- Result: 4th place – $10,000
- Links: Kaggle, GitHub
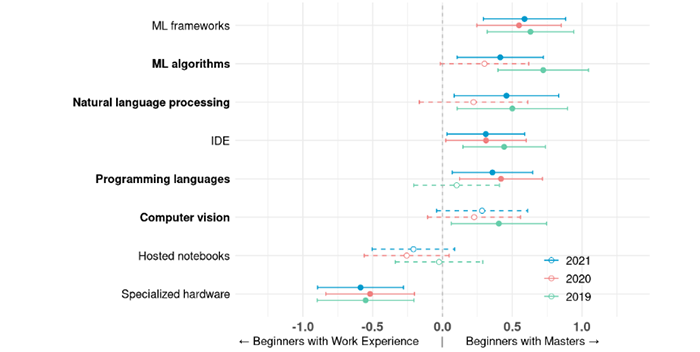
5. Kaggle ML & DS Survey 2021
- Organizers: Kaggle
- Dates: November 8, 2019 – December 2, 2019
- Task: Tell a data story about a subset of the data science community represented in this survey, through a combination of both narrative text and data exploration.
- Data: Survey of around 20,000 Kaggle users about their work, education, skills etc.
- Submission: Comparision of Early-career Data Scientists using Multilevel modelling framework.
- Result: 4th place – $5,000
- Links: Kaggle
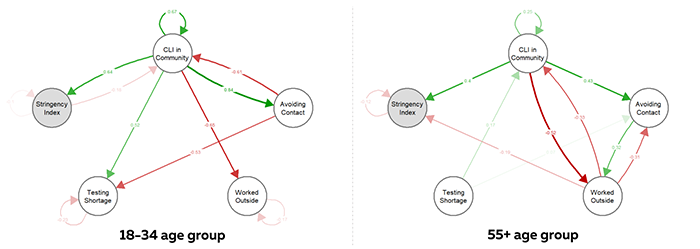
4. The COVID-19 Symptom Data Challenge
- Organizers: Facebook, Carnegie Mellon University, University of Maryland, Duke Margolis Center for Health Policy
- Dates: September 1, 2020 – November 29, 2020
- Task: Develop a novel analytic approach to enable earlier detection and improve situational awareness of the outbreak by public health authorities and the general public.
- Data: Online survey of more than 10 million Facebook users about COVID symptoms, mask wearing, mental health etc.
- Submission: Investigation of causal relationships between COVID-19 cases, people’s behaviour, and governmental actions using Multilevel Vector Autoregression model.
- Result: 2nd place – $30,000
- Links: GitHub, YouTube
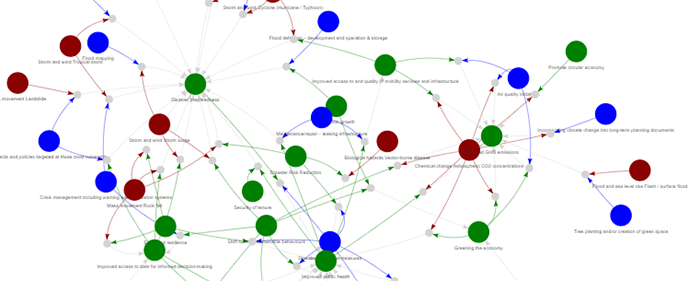
3. CDP - Unlocking Climate Solutions
- Organizers: CDP
- Dates: October 14, 2020 – December 2, 2020
- Task: Develop a methodology for calculating KPIs that relate to the environmental and social issues. Discuss the intersection between them. Demonstrate whether city and corporate ambitions take these factors into account.
- Data: Semi-structured surveys of city officials and corporate managers responsible for the climate change response.
- Submission: Data Envelopment Analysis on obtained KPIs. Investigation of relationships between climate hazards, actions an co-benefits using Association Rules Mining. Exploration of cities reports and using Structural Topic Modelling.
- Result: 2nd place – 25,000$
- Links: Kaggle, GitHub
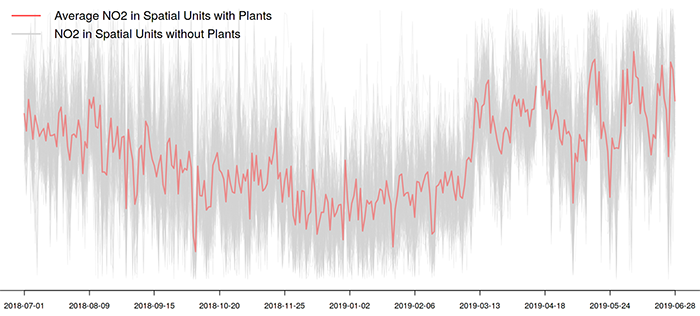
2. DS4G - Environmental Insights Explorer
- Organizers: Google
- Dates: February 11, 2020 – March 24, 2020
- Task: Develop a methodology to calculate an average annual historical emissions factor for the sub-national region.
- Data: Remote sensing data about NO2 emissions, weather conditions, additional information from OpenStreetMap.
- Submission: Methodology for calculating emissions factor using Spatial Panel Model.
- Result: 1st place – $10,000
- Links: Kaggle
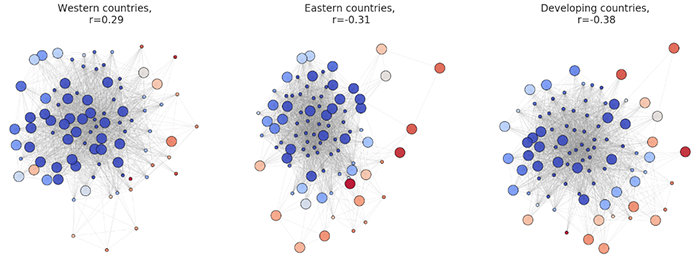
1. Kaggle ML & DS Survey 2019
- Organizers: Kaggle
- Dates: November 8, 2019 – December 3, 2019
- Task: Tell a data story about a subset of the data science community represented in this survey, through a combination of both narrative text and data exploration.
- Data: Survey of around 20,000 Kaggle users about their work, education, skills etc.
- Submission: Story about Kaggle’s PhD community using network analysis: network of participants, skills, and countries.
- Result: 2nd place – $8,000
- Links: Kaggle